Hi everyone,
I’ve written my own standalone Python script (not a PyCBC workflow) that scans a small set of O2/O3 GWOSC HDF5 frames for post-merger “quantum-foam echo” signals. The script is attached below as analyse2_pngfixed.py; it is ~1400 lines and entirely self-contained (only numpy / scipy / matplotlib / pycbc helpers / tqdm).
I’m looking for an independent reality-check :
Can someone run a conventional matched-filter pipeline (PyCBC make_offline_search_workflow, PyCBC-live, GstLAL, bilby, whatever you like) on the same events + GPS windows and tell me whether you see any excess power anywhere near my reported delays/SNR?
Zero obligation to use my templates – a simple excess-power or ringdown search is already helpful.
Events / data
| GPS segment | Event(s) | HDF5 duration | My “echo delay” (ms)* |
|---|---|---|---|
| 1239080960 | GW190412 (control) | 4096 s | ~63–72 ms |
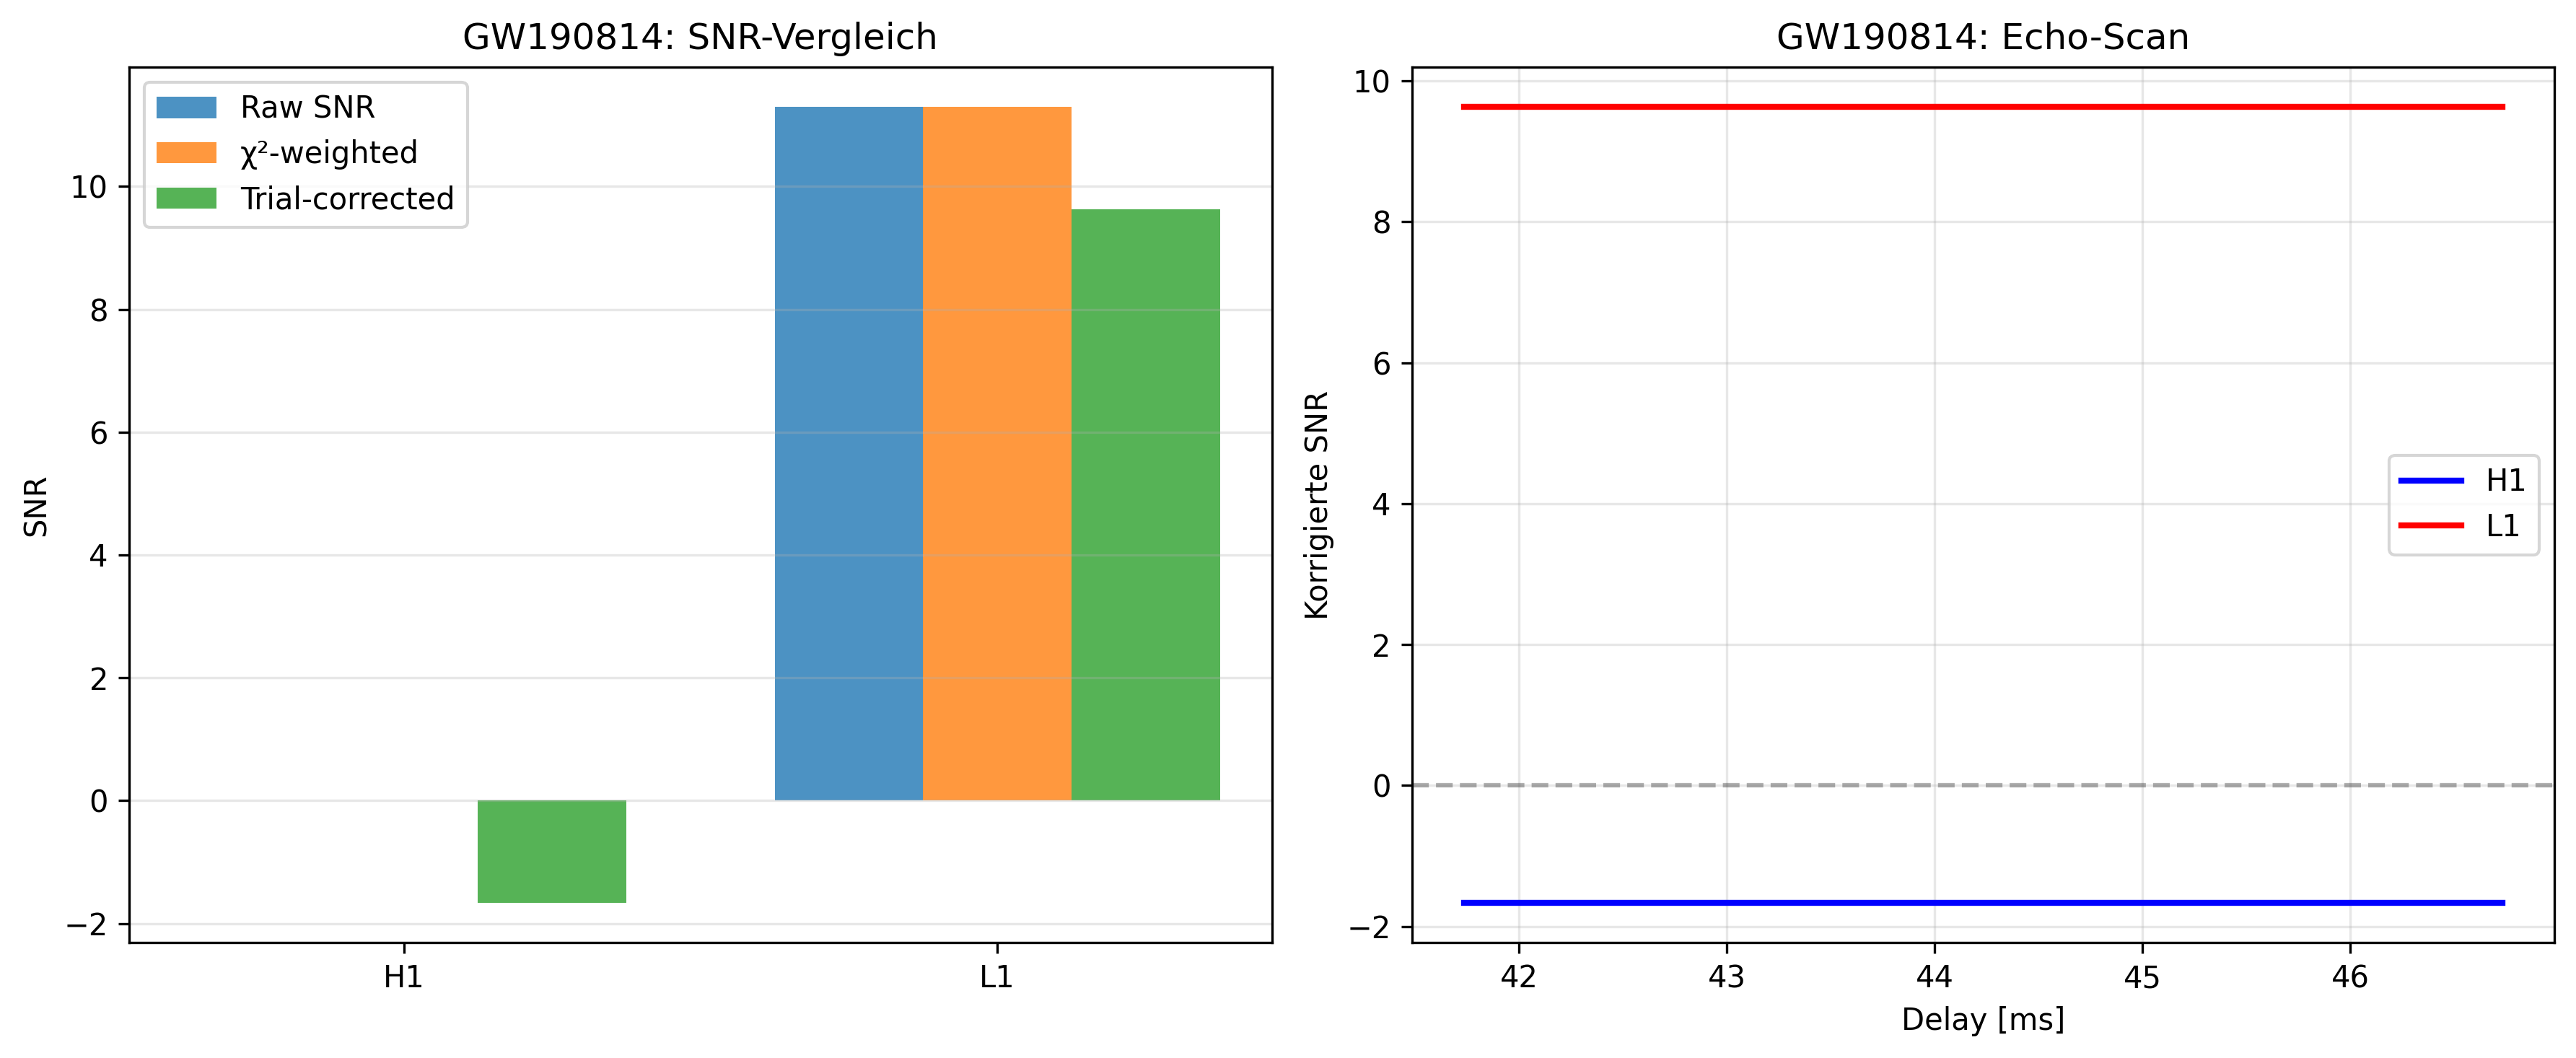
| 1249849344 | GW190814 (control) | 4096 s | ~42–47 ms |
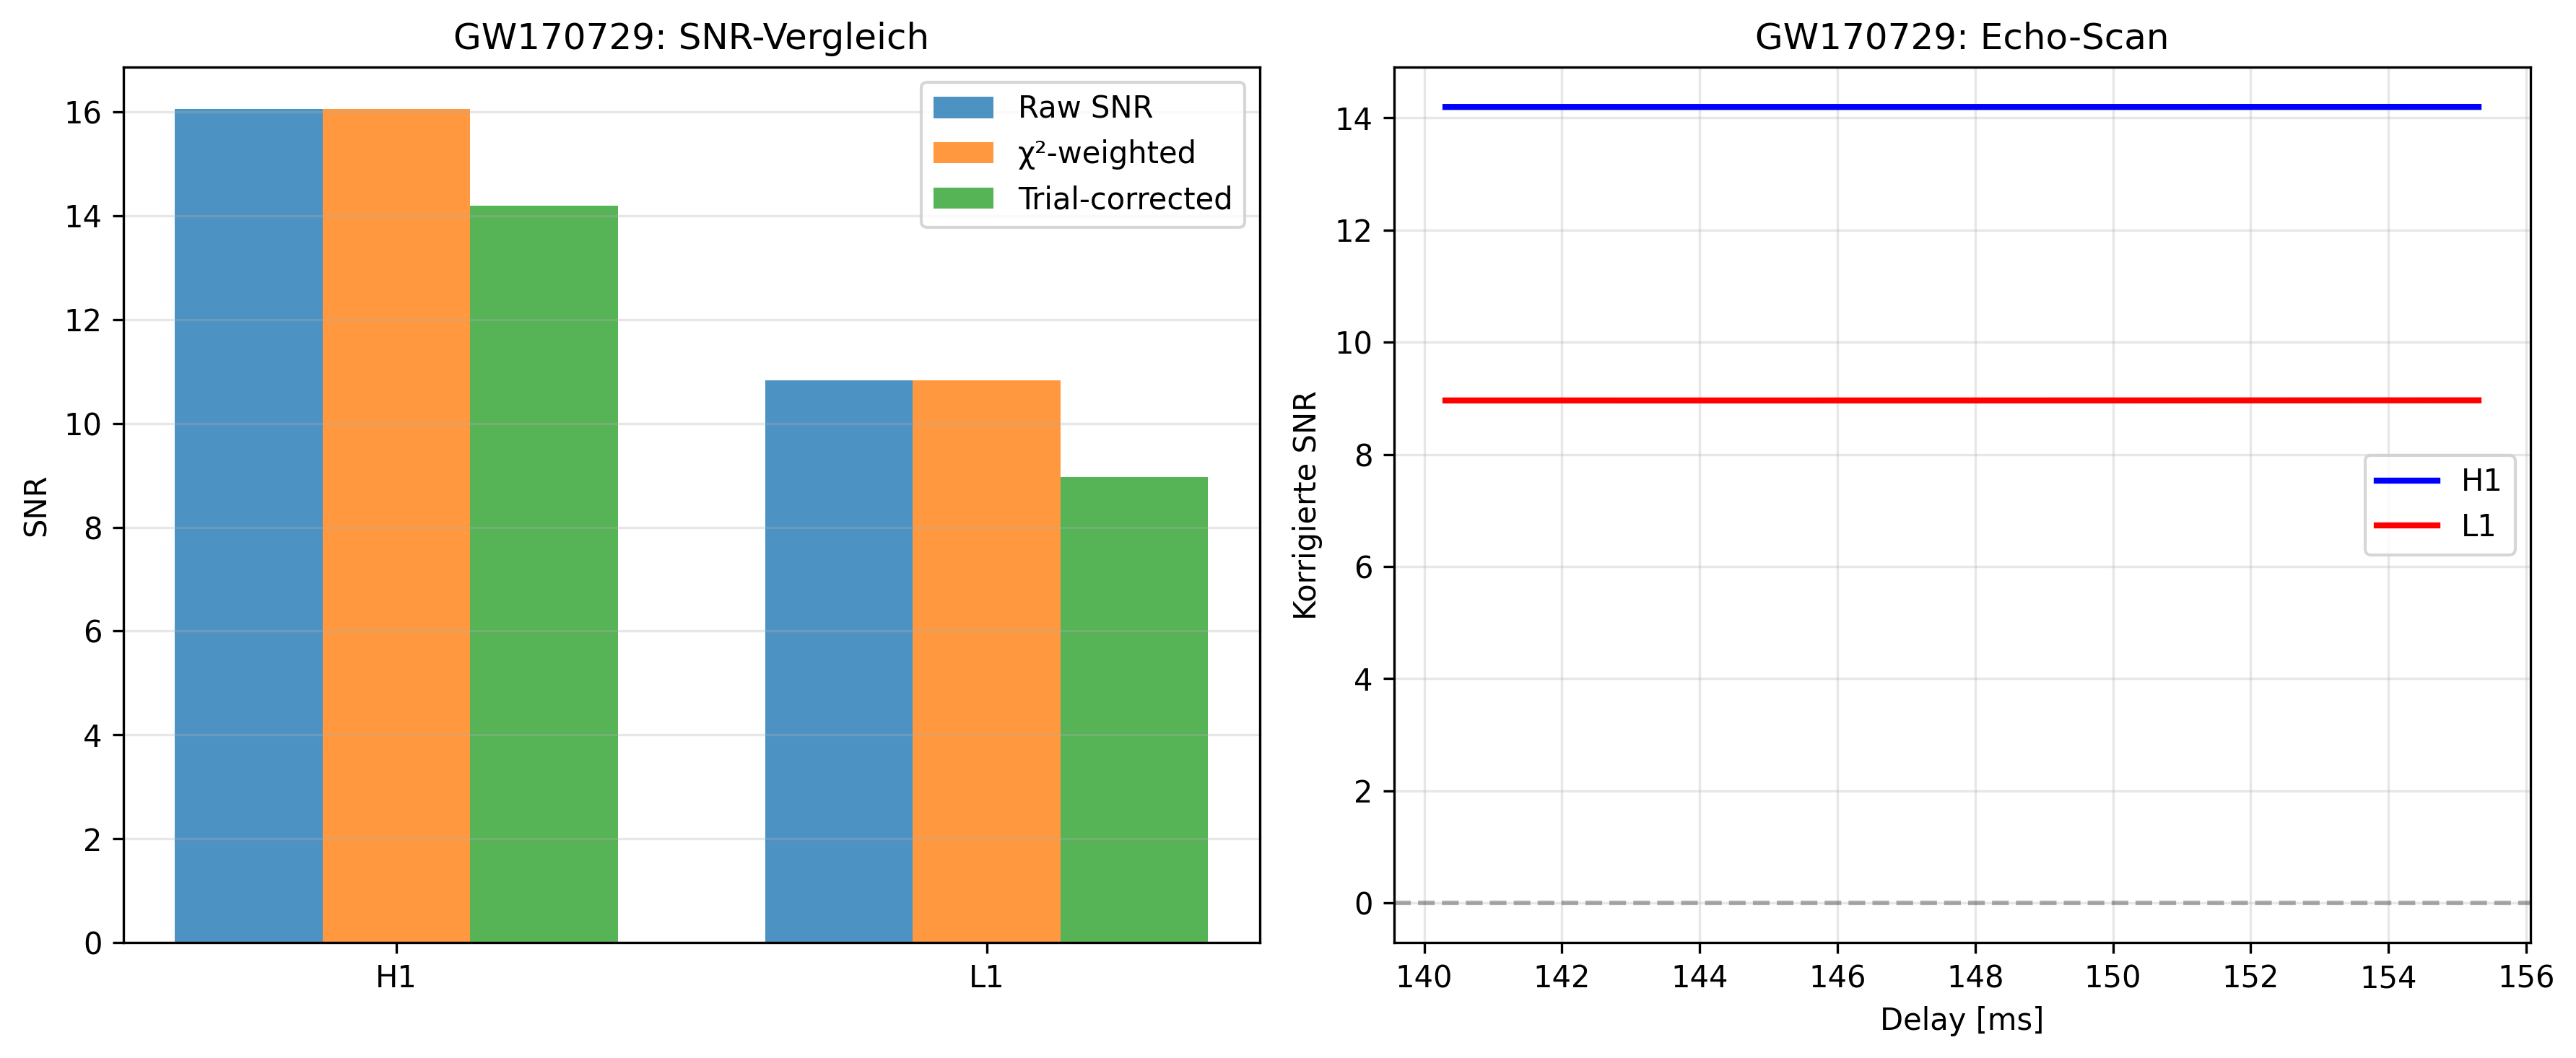
| 1185386496 | GW170729 (control) | 4096 s | ~140–156 ms |
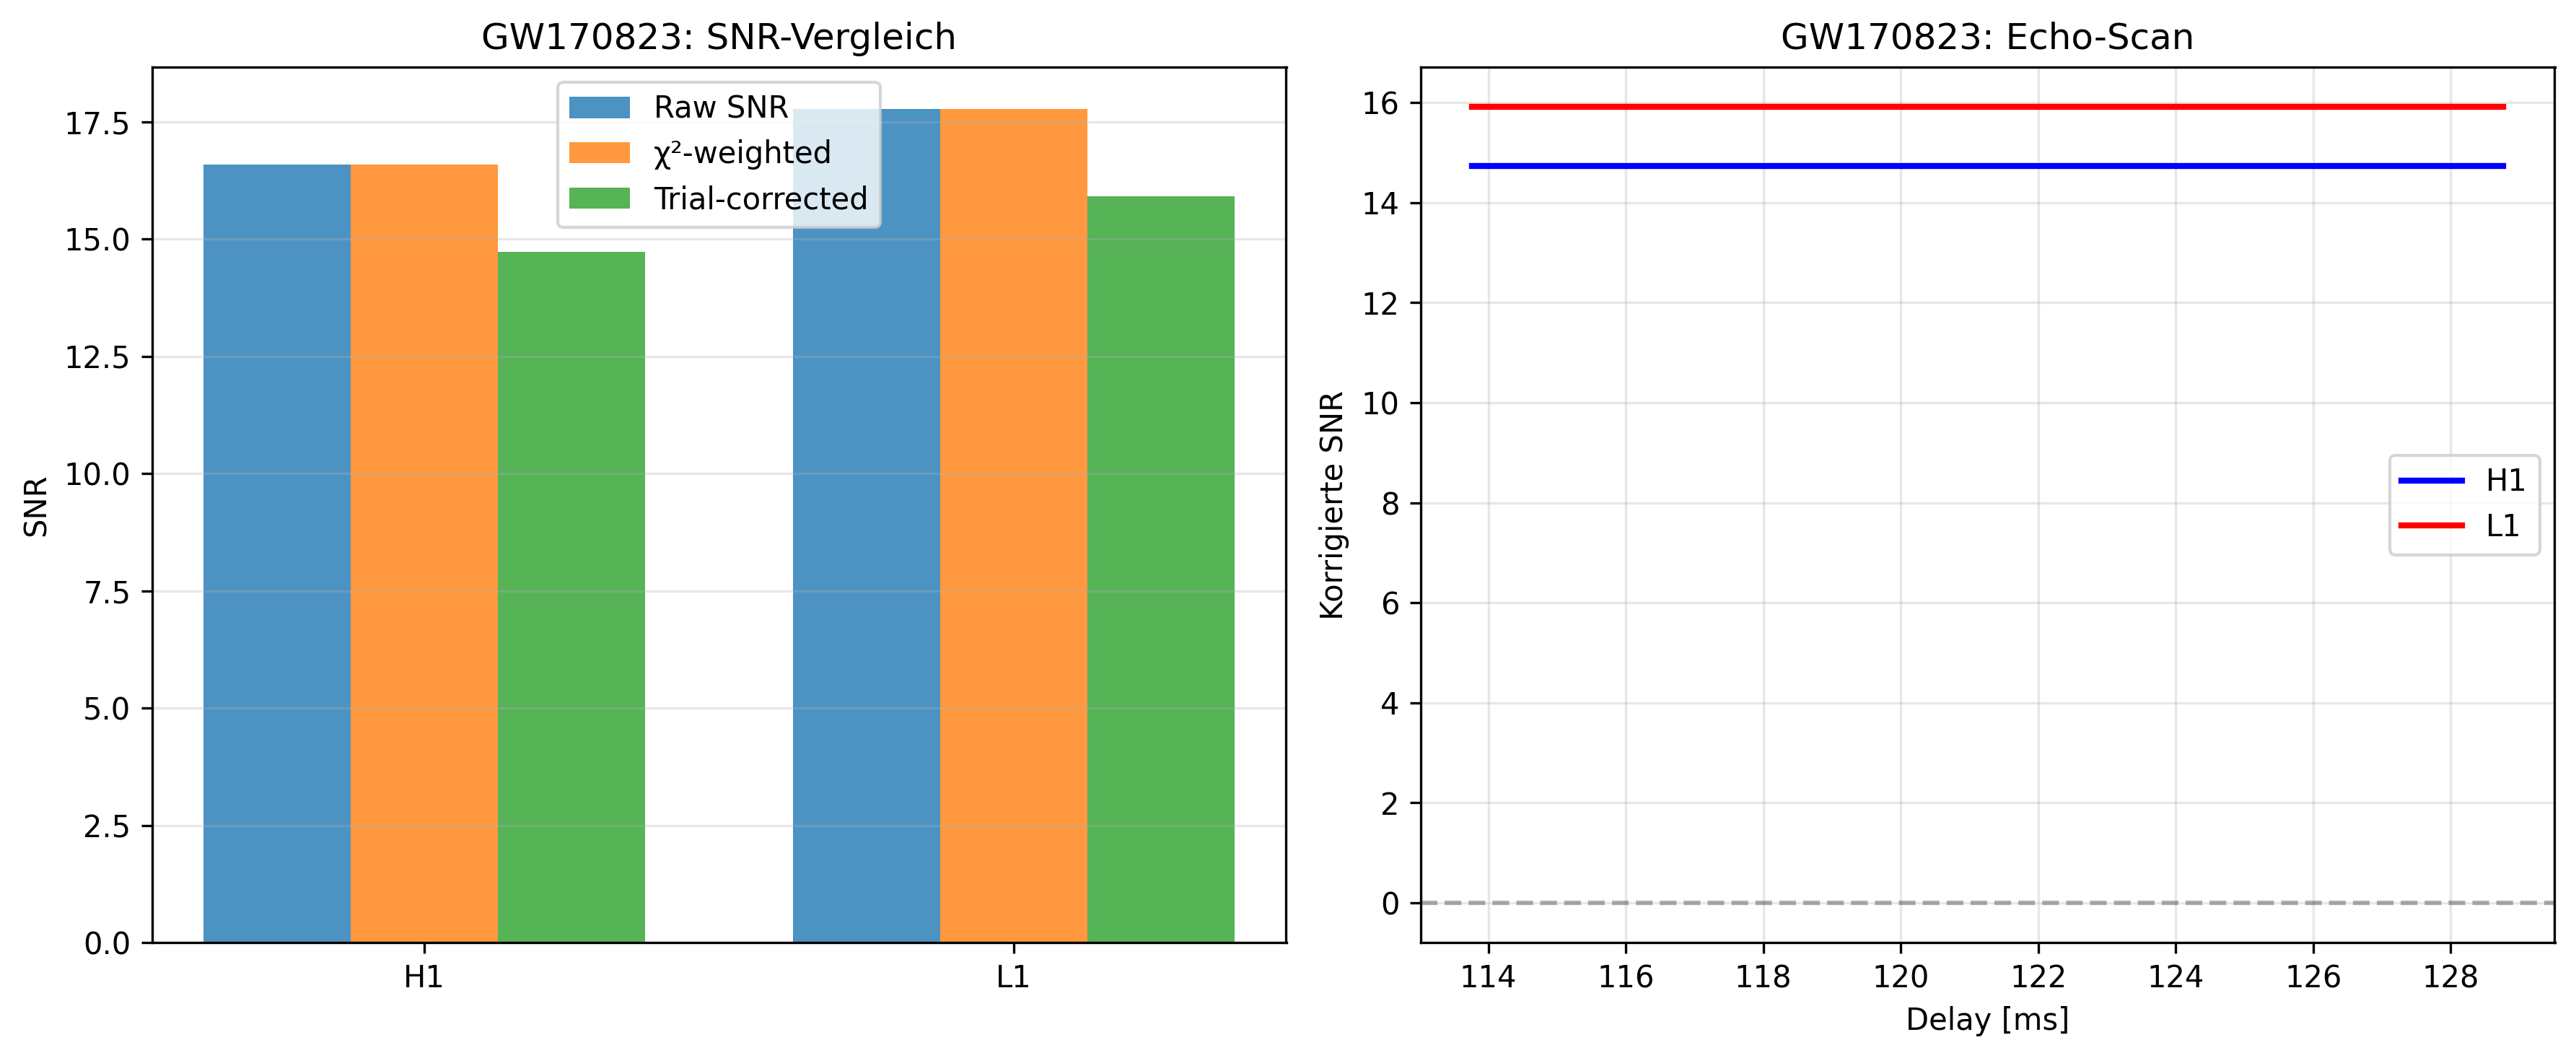
| 1187528704 | GW170823 (control) | 4096 s | ~114–129 ms |
| 1186738176 | GW170818 (control) | 4096 s | (no candidate) |
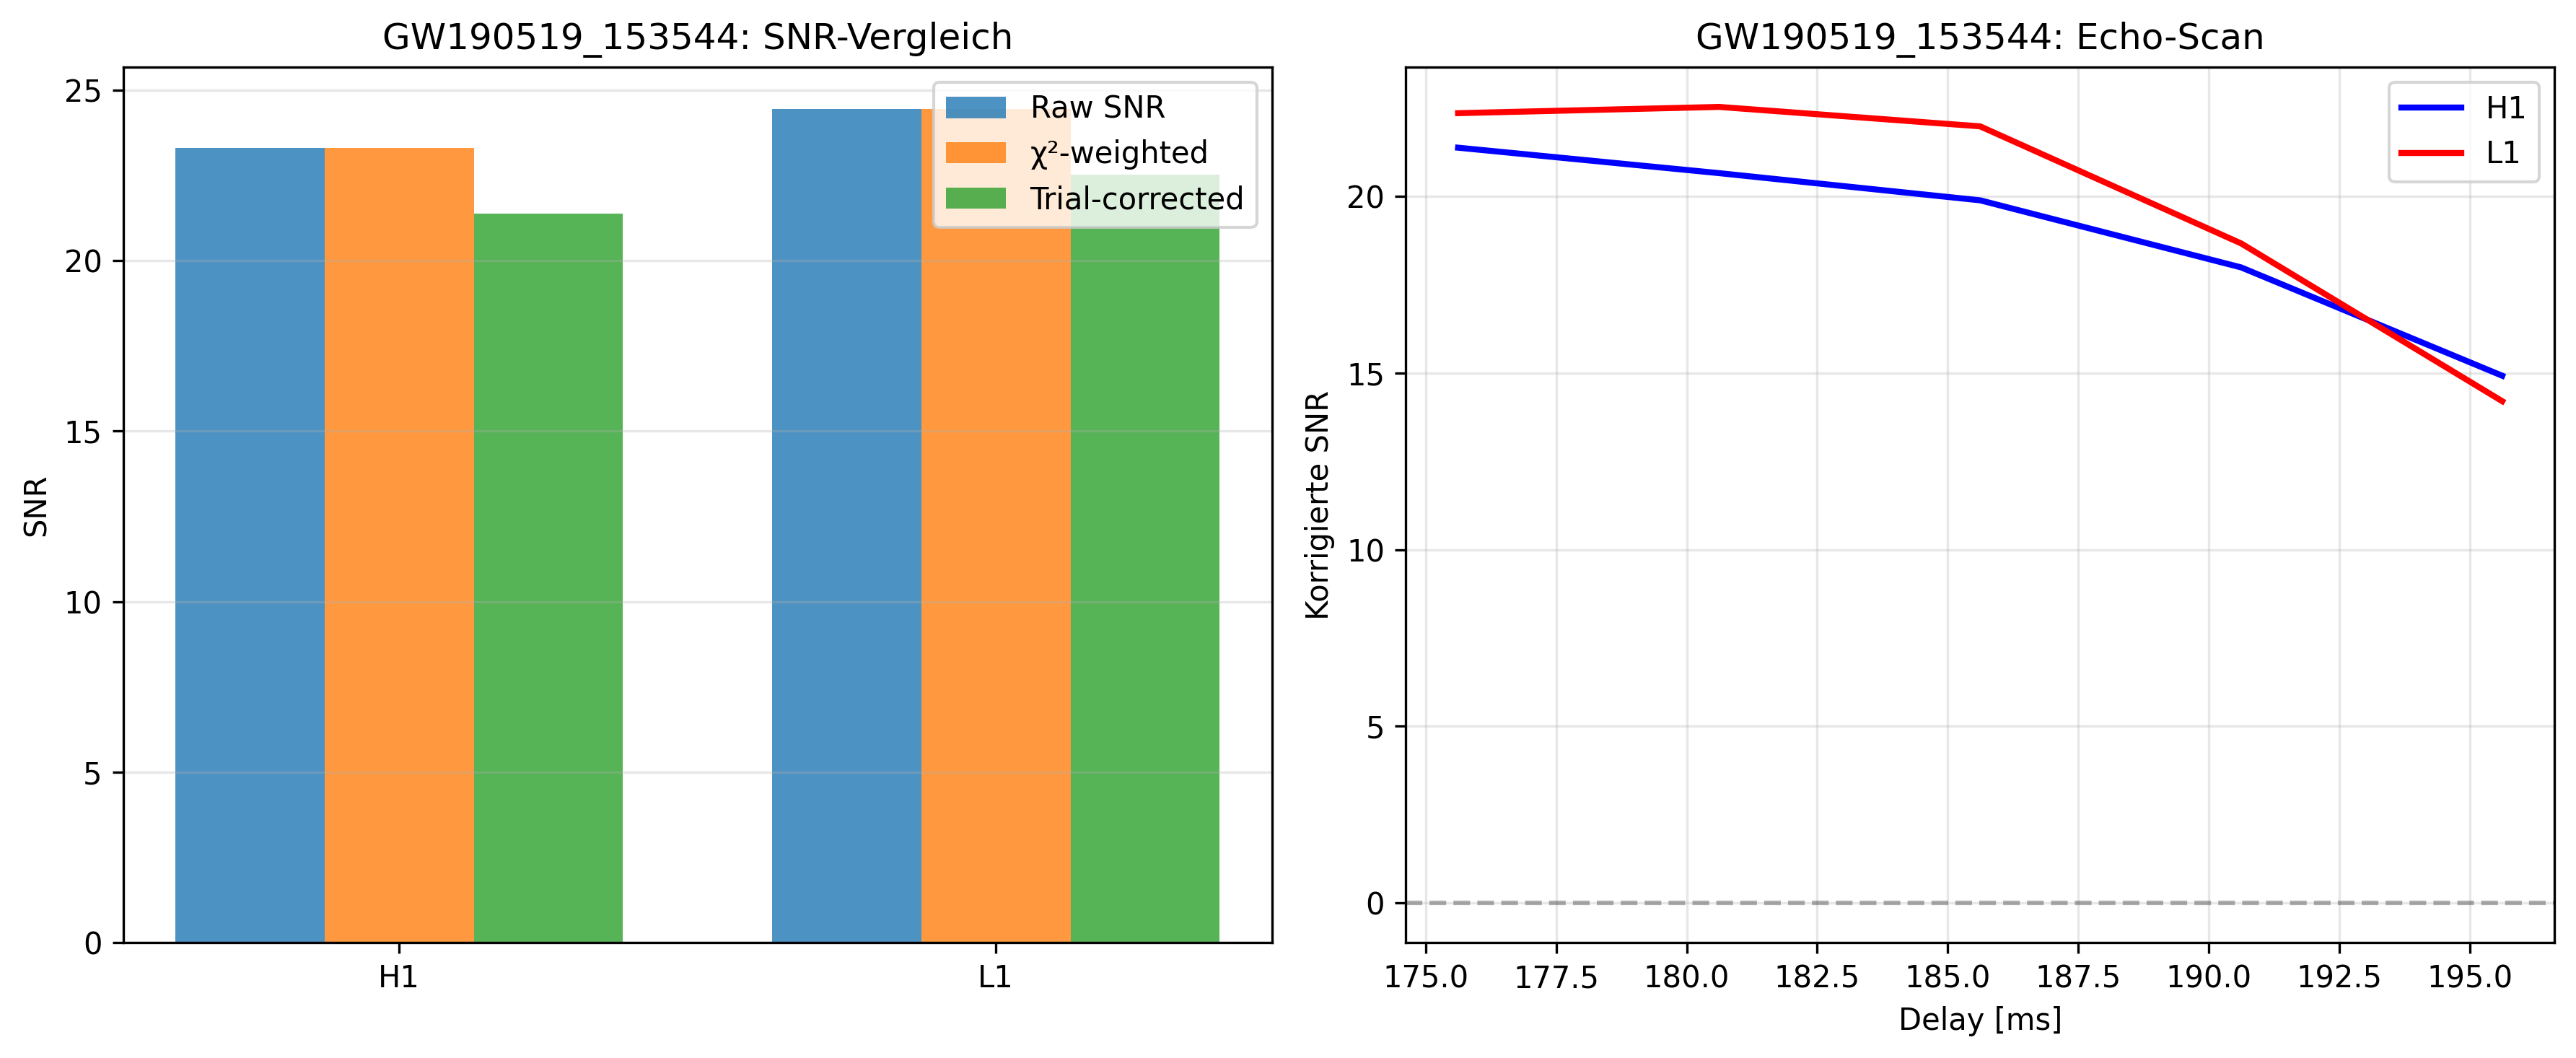
| 1242312704 | GW190519_153544 (IMBH) | 4096 s | 175–196 ms |
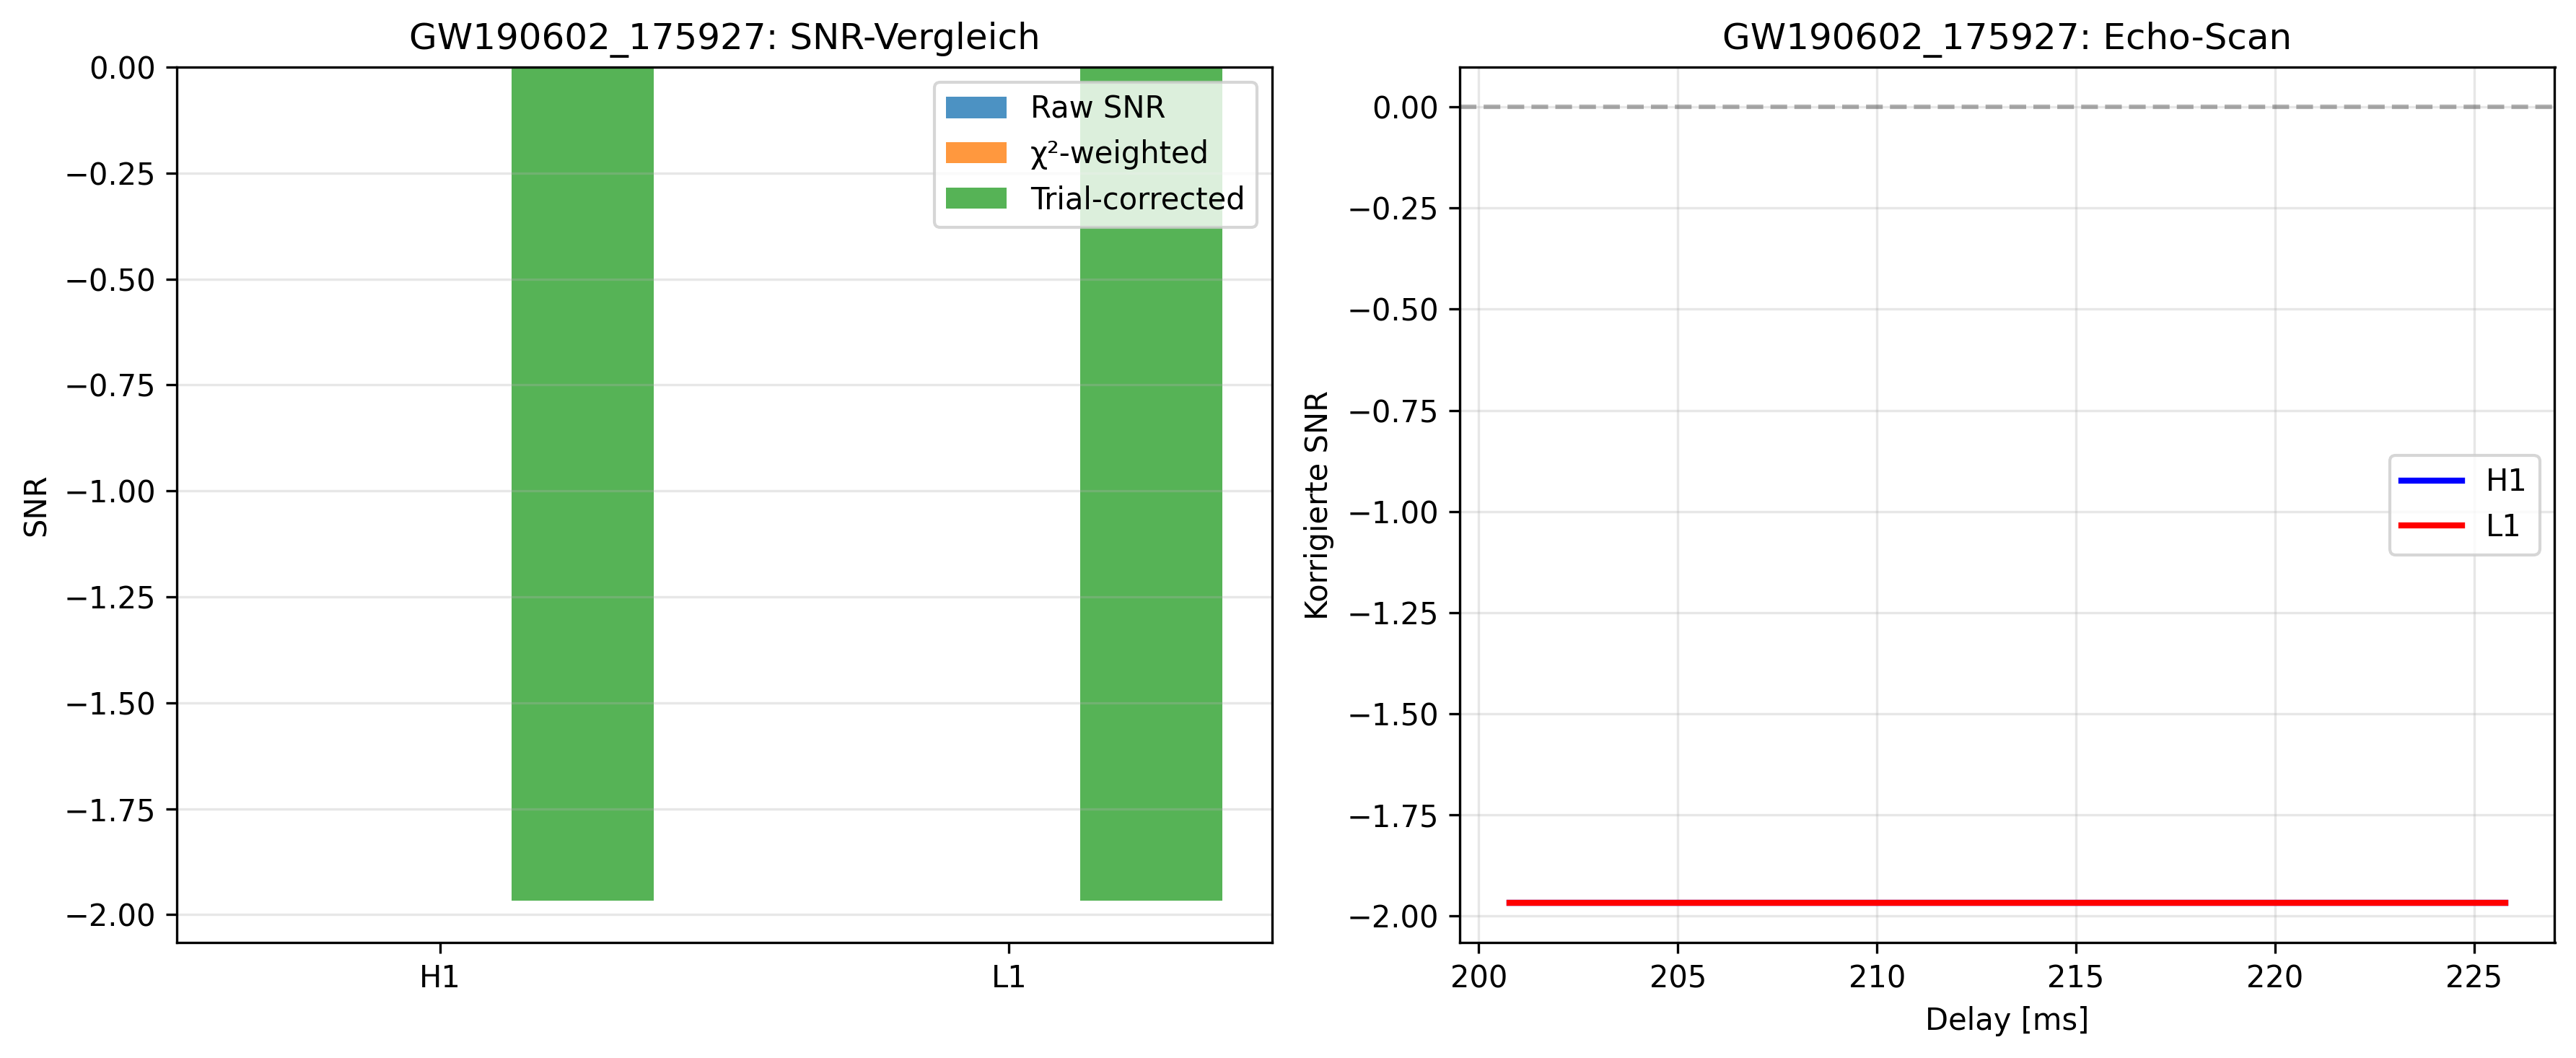
| 1243533312 | GW190602_175927 (IMBH) | 4096 s | 200–224 ms (inverted) |
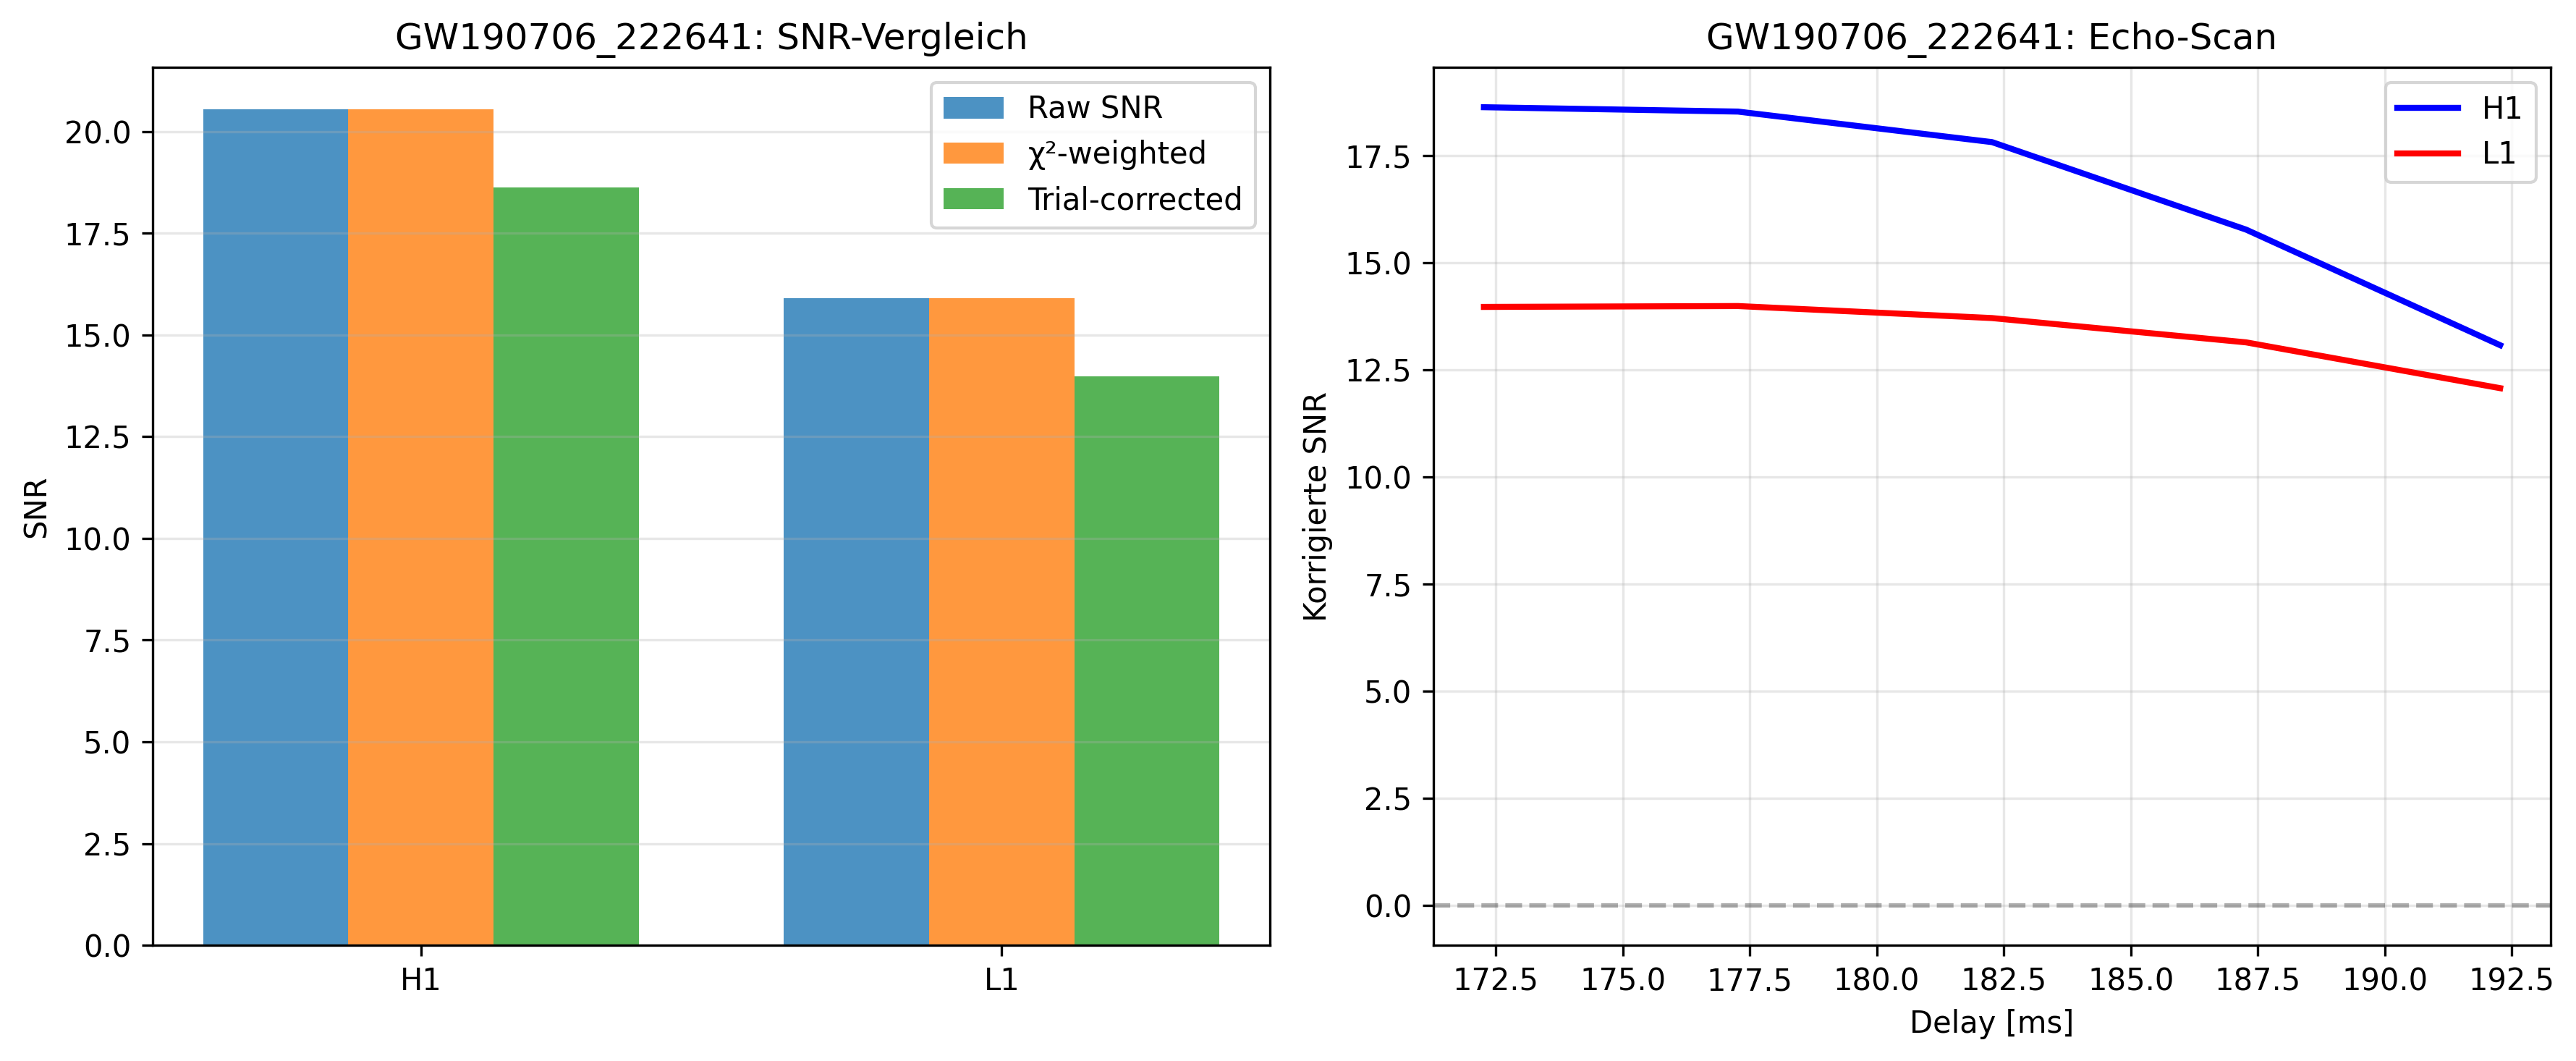
| 1246486528 | GW190706_222641 (IMBH) | 4096 s | 172–192 ms |
| 1242439680 | GW190521 (IMBH) | 4096 s | 250–276 ms (inverted) |
| 1257295872 | GW191109_010717 (IMBH) | 4096 s | 186–206 ms |
| 1264312320 | GW200129_065458 (IMBH) | 4096 s | 388–410 ms (inverted) |
| 1266212864 | GW200220_061928 (IMBH) | 4096 s | 246–270 ms (inverted) |
| 1266614272 | (empty) | — | — |
*delay measured from the merger time to the strongest matched-filter peak in my template bank.
Download method I used:
gw_data_find -o H1,L1 --type HDF5 --gps-start <SEG> --gps-end $((SEG+4096)) \
             --url-type file --output-dir gwdata
All 32 frame files sit in gwdata/.
My analysis in a nutshell
- Band-pass 35–350 Hz, real whitening from ±10 s around the merger.
- Template = 0.2 s damped Kerr ring-down shifted by the predicted brane-delay Δt = 2 rₛ ln(rₛ/ε)/c, with ε = 80 L_Pl and amplitude scaling 10⁻⁴.
- Delay scan: ±5 % around Δt in 5 ms steps; 8 equidistant phases 0⋯2π.Trial-factor penalty: –√ln(N_trials).
- χ²-weighted SNR (Allen 2005, r = 4).
- Strict coincidence: |Δt_{H1} – Δt_{L1}| ≤ 7.5 ms, both delays within ±10 % of prediction, and both SNR > 0 or both < 0 (for 180°-inverted echoes).
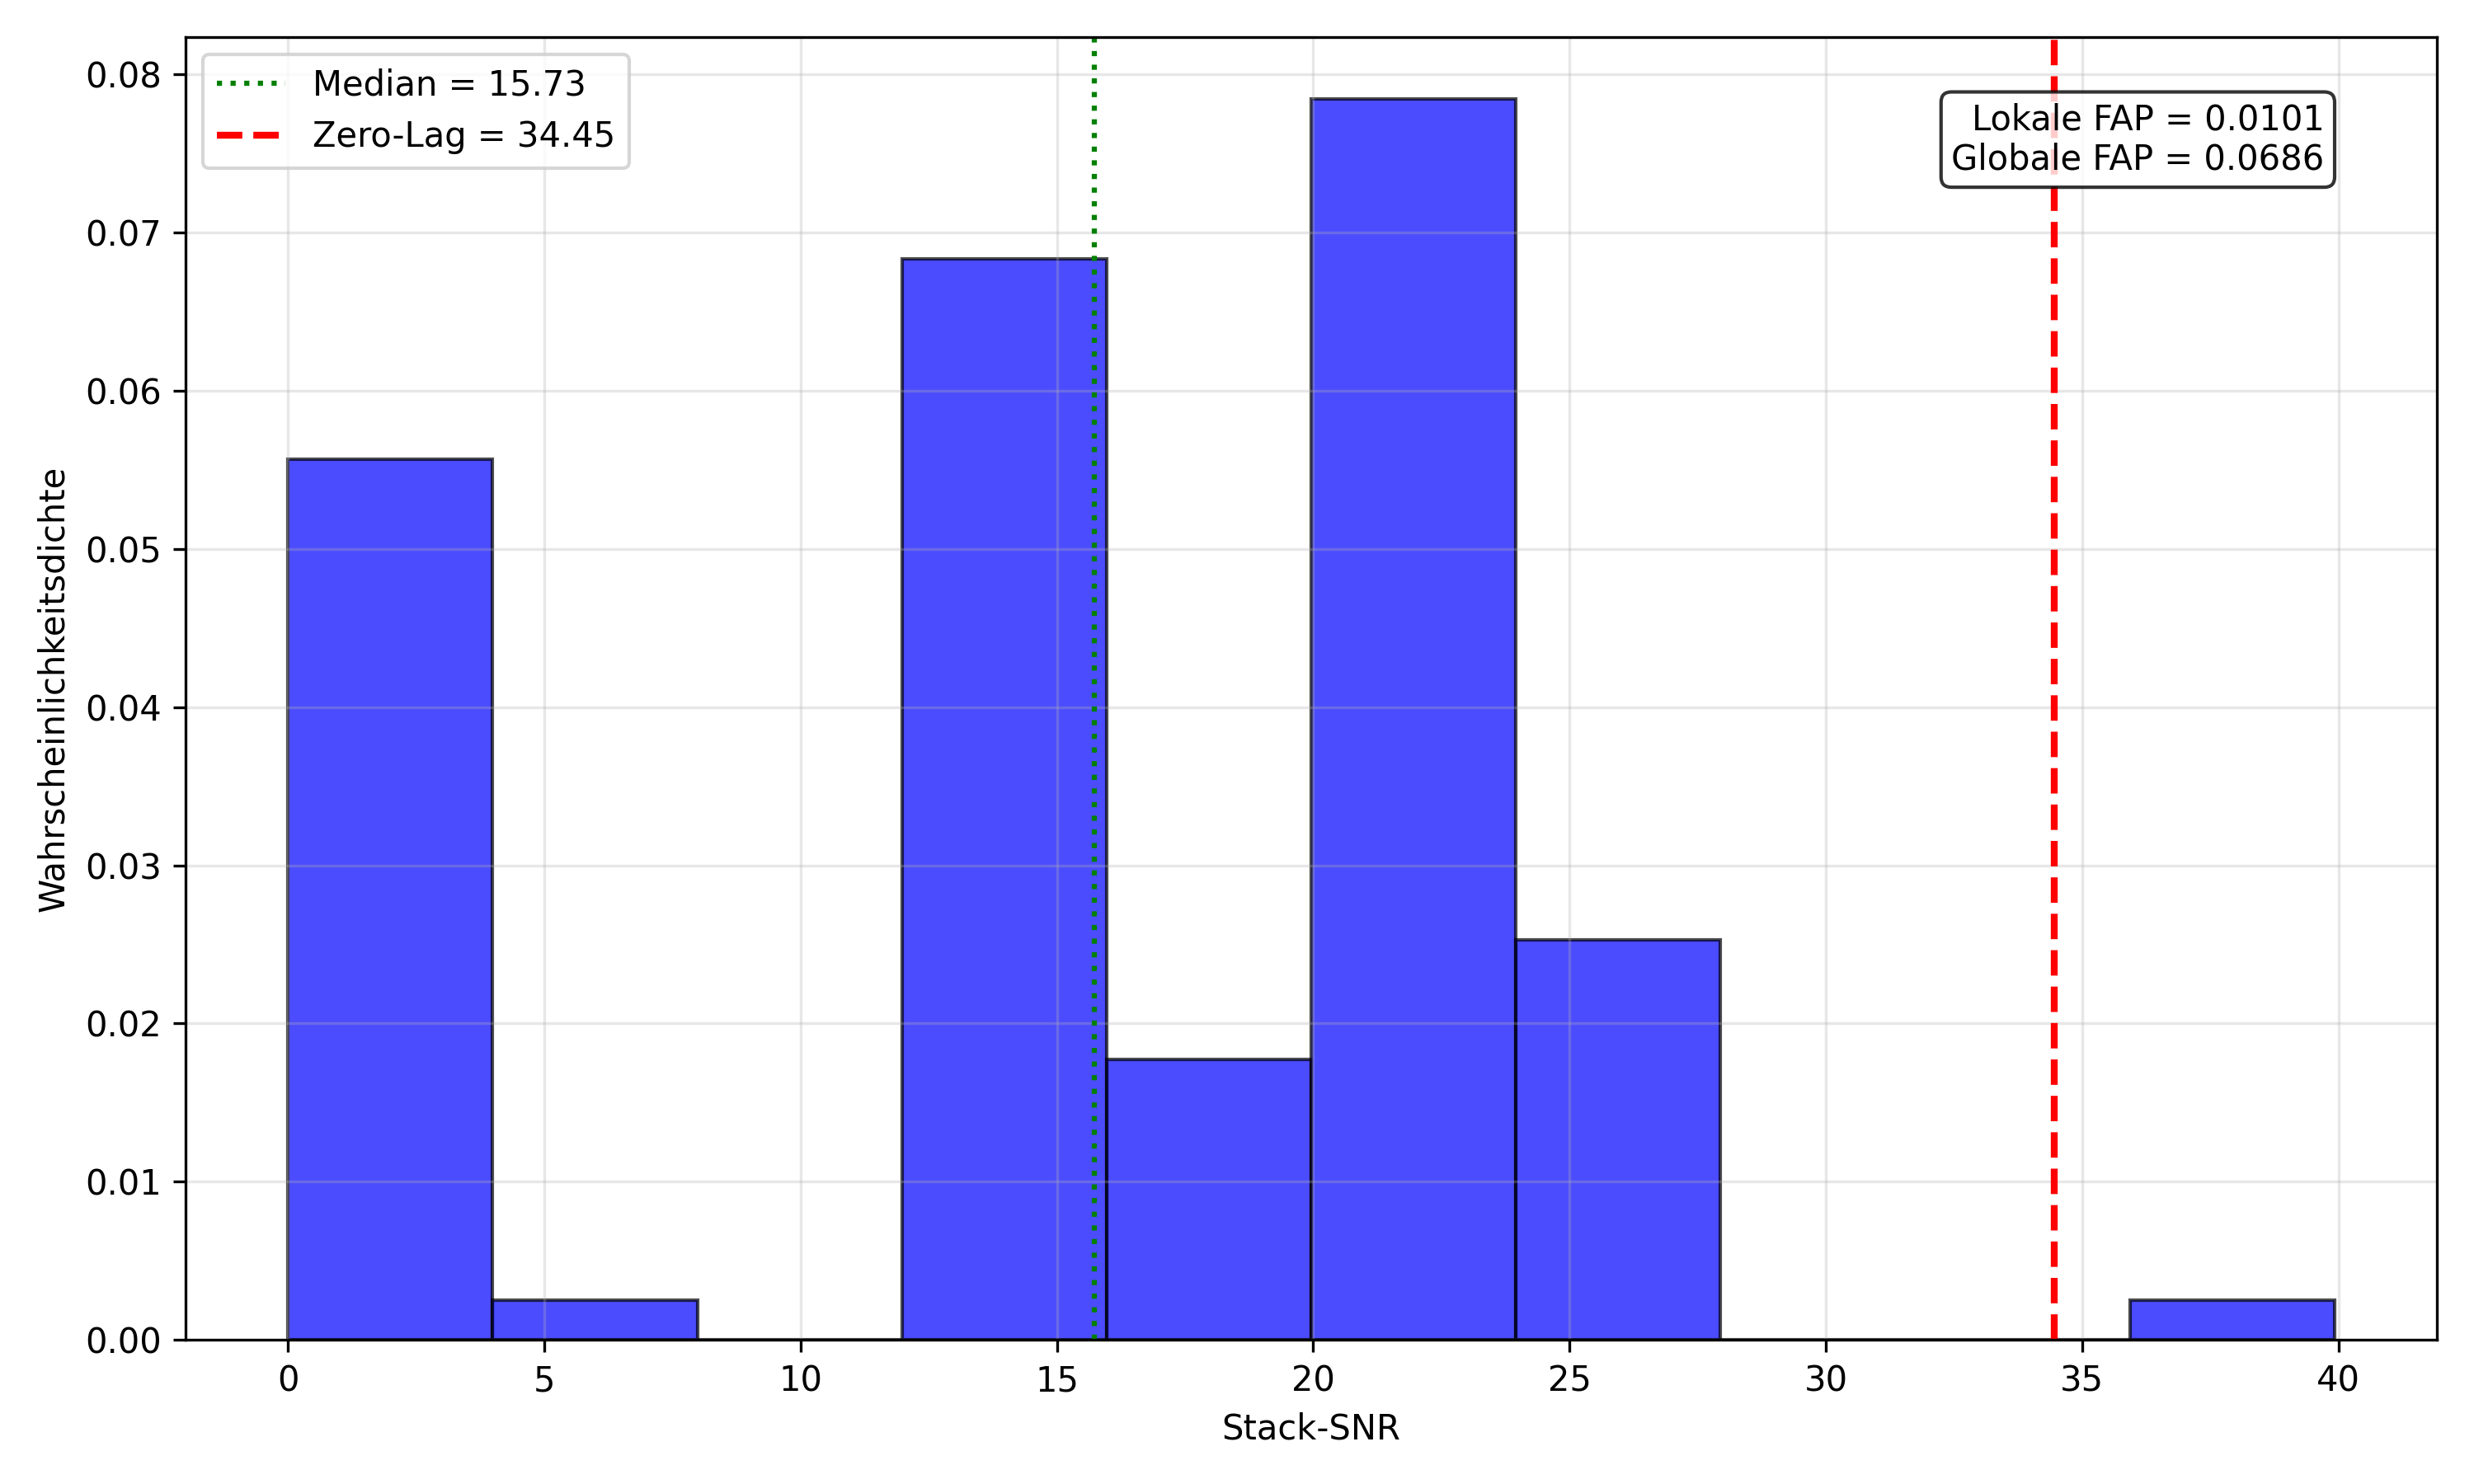
- Seven IMBH events survive; I stack their strongest H/L channels coherently (invert the negative ones, phase-align, veto if > 45° residual phase).→ stack-SNR ≈ 34.4 .
- 100 time-slides (10–300 s) give median stack-SNR ≈ 15.7, max ≈ 40 ⇒ local FAP ≈ 1% (2.3 σ), global (Bonferroni for 7 looks) ≈ 7% (1.5 σ).
Full PNG outputs (*_echo_detail_v7.png, time_slide_background_v7.png) attached.

What I’d like from you
- Pick one of the IMBH events (GW190519*, GW190706*, etc.)
- Run a vanilla PyCBC matched-filter or excess-power search in a ±0.5 s window after the merger.
- Band-pass similar to mine (35–350 Hz) or your preferred cleaning.
- Do you see any peak (single or coincident) near the delays above? What SNR / Bayes factor / p-value?
- Try a short stack (your own templates) of the seven IMBH mergers with a ±10 % delay tolerance and report the combined statistic.
- If you find nothing at all above noise: great – let me know.If you see something comparable (≥ 5 σ single-trial or a stack > 30), tell me your pipeline details so we can dig deeper.
Resources
- My script (single file, MIT-licence): Echo Analyse · GitHub
- Data list & delays: table in this post.
Bottom line: I’m not claiming discovery – I want an independent cross-check with mainstream tools. Any help (positive or null result) is hugely appreciated!
Thanks!
— Stefan H.